Ch 3: Interpreting and Asking Questions about Time-Frequency Results
This chapter discusses what kinds of inferences we can pull from EEG signal uses time-frequency analysis
3.1 EEG Time-Frequency: The Basics
EEG signals are rhythmic from the neural oscillations of neural populations in various regions of the brain firing in sync. Oscillations can be characterized by their frequency, their power (strength), and their phase (the angle a sine wave crosses the zero point of the power axis). There are some common frequencies seen in the brain which are broadly separated into named bands by their frequency:
- Sub-Delta: Below 2 Hz
- Delta: 2-4 Hz
- Theta: 4-8 Hz
- Alpha: 8-12 Hz
- Beta: 15-30 Hz
- Lower Gamma: 30-80 Hz
- Upper Gamma: 80-150 Hz
- Omega: 150-600 Hz
Note these aren't rock solid definitions, you may see some deviance on what frequency goes to what band. Generally, cognitive activity occurs within 2-150 Hz. Changes in one's neural-oscillation activity can be correlated with change in cognitive state.
There are compromises with time-freq analysis when it comes to temporal resolution or better precision. The wider the band of time allocated to the analysis, the more accurate / more frequencies the analysis can pick up, but the less temporally accurate it will be.
Background brain activity also contributes to EEG data, not just the data you are searching for. Baseline normalization can reduce this.
There is also a distinction between phase locked activity and non-phase locked activity, where phase locked activity has similar signal phase between trials, non-phase locked activity will have different phases between trials, even with time-tacked trial events. ERPs are an example of phase locked activity.
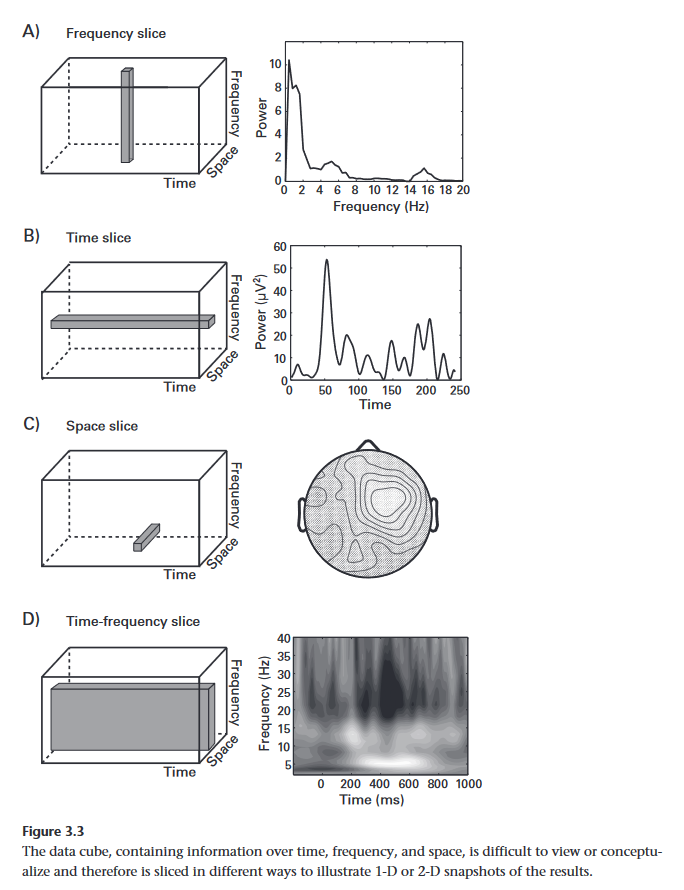
3.2 Ways to View Time-Frequency Results
Time-Frequency results can be imagined as a 3D cube, with the dimensions representing frequency, space (electrode location), and time. Slicing this cube as flat sections results in various graphs that one can use to interpret data.
3.3 tfviewerx and erpviewerx
These are the names of small utilities the author wrote in MATLAB to visualize this data in this format. They can be found on this Textbooks github repository.
3.4 How to View and Interpret Time-Frequency Results
General process to understand these plots:
- Check Plot Axis and Labels
- Check the results
- Think how do these results correlate with what the experiment was trying to test
- check for experiment events
- What statistical analysis was done on the graph? Any smoothing, thresholding?
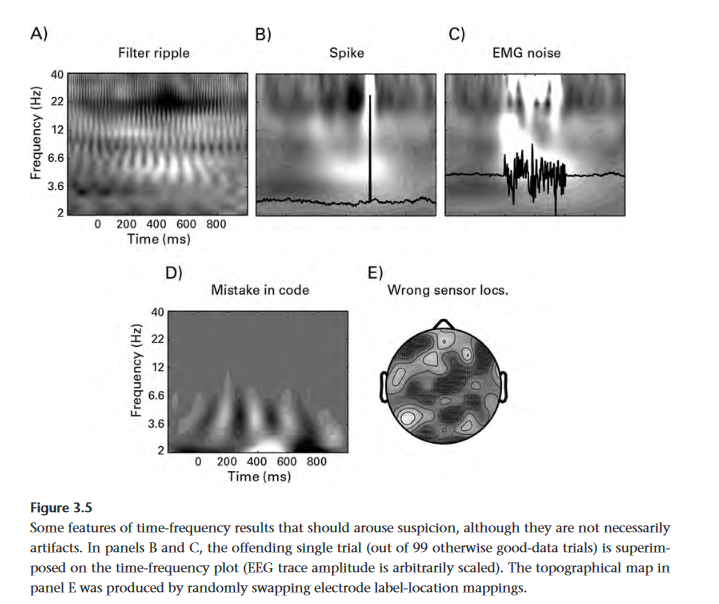
3.5 Things to be suspicious of When Viewing TIme-Frequency Results
- Stripes / filter "ripple"
- filters may be too narrow / not enough data included
- Sudden massive Spike
- noise spike, possible bad electrode
- even one trial like this can seriously skew results
- noise spike, possible bad electrode
- Broad EMG noise
- EEG cap moved, muscle activity
- Impossibly fast color changes
- possibly bugged code
- Many peaks in a topographical map:
- possibly incorrectly placed electrodes'
3.6 Do Results in Time-Frequency Plots Mean That There Were Neural Oscillations
This is a complicated question. Since EEG measures populations of neurons, which oscillate, in makes sense if EEG data reflects that. However, Technically any signal can be decomposed into sine waves.